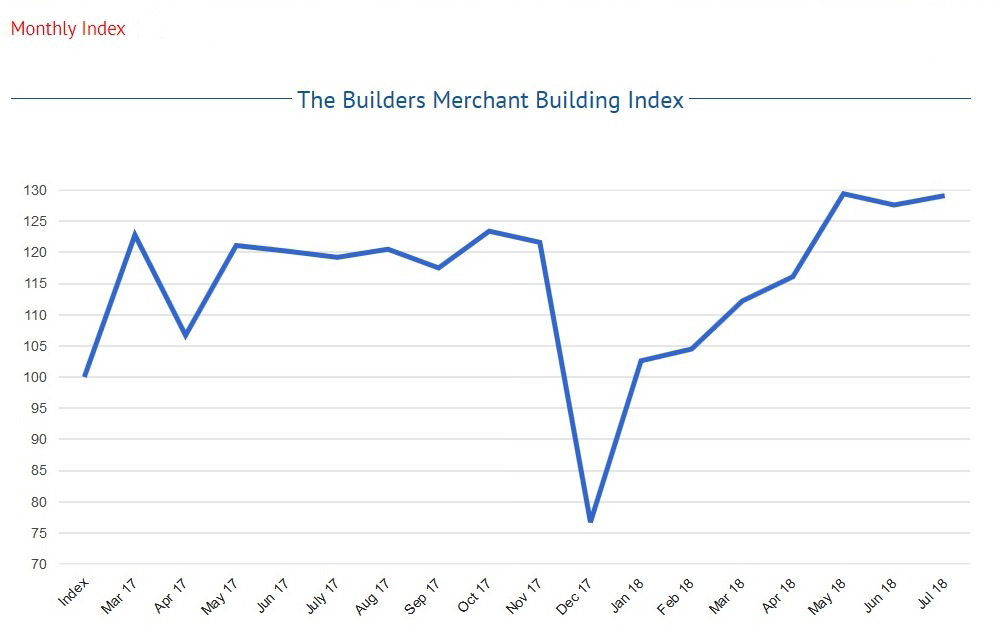
The increase was helped by the month having one extra trading day than both June 2018 and July 2017. Average sales per day in July were actually 3.5% lower than in June but there has been growth year on year.
The latest Builders Merchant Building Index (BMBI) shows that three product categories achieved their highest monthly sales in the four years that the data has been compiled: heavy building materials, timber & joinery products and decorating.
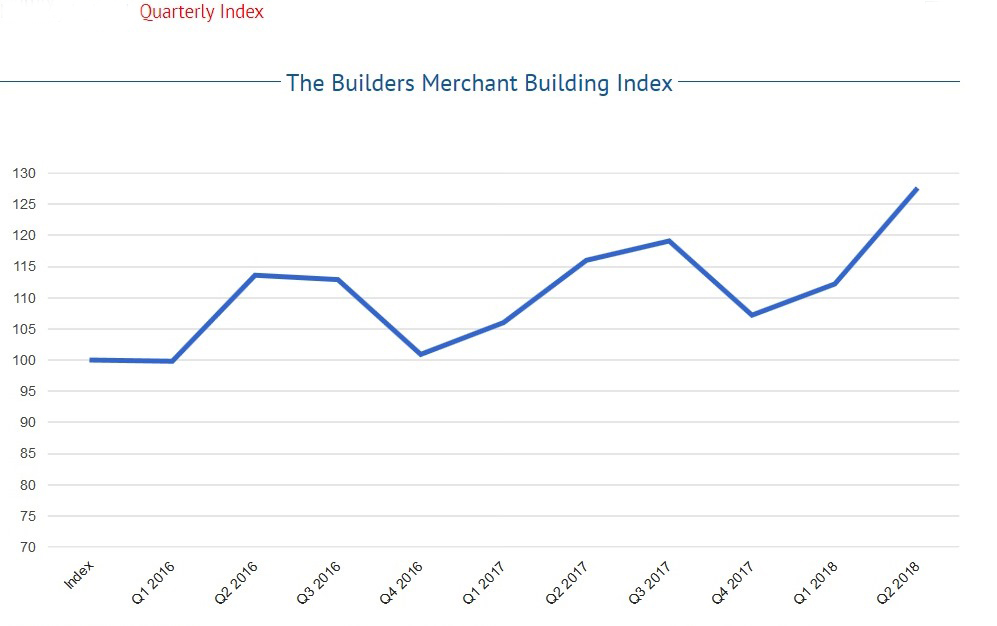
The first seven months of 2018 were 4.6% ahead of the same period in 2017, with one additional trading day this year. The plumbing heating & electrical category grew the most, by 10.4%, while sales of timber & joinery products are up 7.0% year-to-date, compared to 2017. Average daily sales a day for January to July 2018 were up 3.9% on the same months last year.
The rolling 12 months August 2017 to July 2018 saw sales up 5.0% compared to the same period a year earlier. All categories saw growth but none more than plumbing heating & electrical (up 9.3%).
July’s BMBI index was 129.1, with one additional trading day. Landscaping was top (156.6) followed by timber & joinery products (131.1) and heavy building materials (128.8).
The Builders Merchant Building Index (BMBI) tracks builders’ merchants’ actual sales to builders and contractors using GfK’s point of sale tracking data. The BMBI represents more than 80% of the value of the builders' merchants' market.
Got a story? Email news@theconstructionindex.co.uk